




M-01
Find the constraint
Map how dollars, customers, and intangible capital move through the business to find the few areas that are most limiting your profits.
Bishop Foundry tailors value creation plans to your capital discipline so you can win on acquisition and exit in an AI-driven landscape.
Consultants who don't have the skills to find value in your company on their own will dump your data into Claude Code and regurgitate vibe-coded suggestions that waste your time, money, and energy.
A track record across
Our approach creates a structure that makes us maximally accountable for providing value:
Fig. F-04 — Sample dashboard / illustrative
Insight: Feature X is widely enabled but has poor retention. We recommend unlocking information value by instrumenting the feature's substeps to address potential onboarding and time-to-value gaps.
Unlocked · 1 of 7 interventions
+50 bps
EBITDA margin
P10 +25 · P90 +100 bps
New feature X accounts reaching first value within 30 days
Chance this is the final stage
| Outcome | Chance | Net |
|---|---|---|
| Stop after instrumentationNo fixable drop-off in feature X's substeps | 20% | −$15,000 |
| Stop after the pilotFixing the drop-off doesn't get pilot accounts to value from feature X | 25% | −$30,000 |
| Stop after rolloutMore accounts get value from feature X, but retention doesn't rise within 12 months | 15% | −$45,000 |
| Retention benefit realized$150k annual run rate of EBITDA from retained revenue, less $45k total outlays | 40% | +$105,000 |
Expected net value
+$24,750
Expected gains $42,000 − expected losses $17,250.
EV = 20% × (−$15k) + 25% × (−$30k) + 15% × (−$45k) + 40% × ($105k)
An illustrative dashboard for a $30M-revenue software company, not a client result. Exactly one staged outcome occurs; each includes the outlays before stopping, and success assumes the median uplift as an annual run rate of EBITDA, after flow-through margin. The uplift's range comes from simulating every factor at once.
Methods / scientific foundations
How we use AI to make the methods of $1B+ revenue firms accessible without sacrificing comprehensiveness or precision.
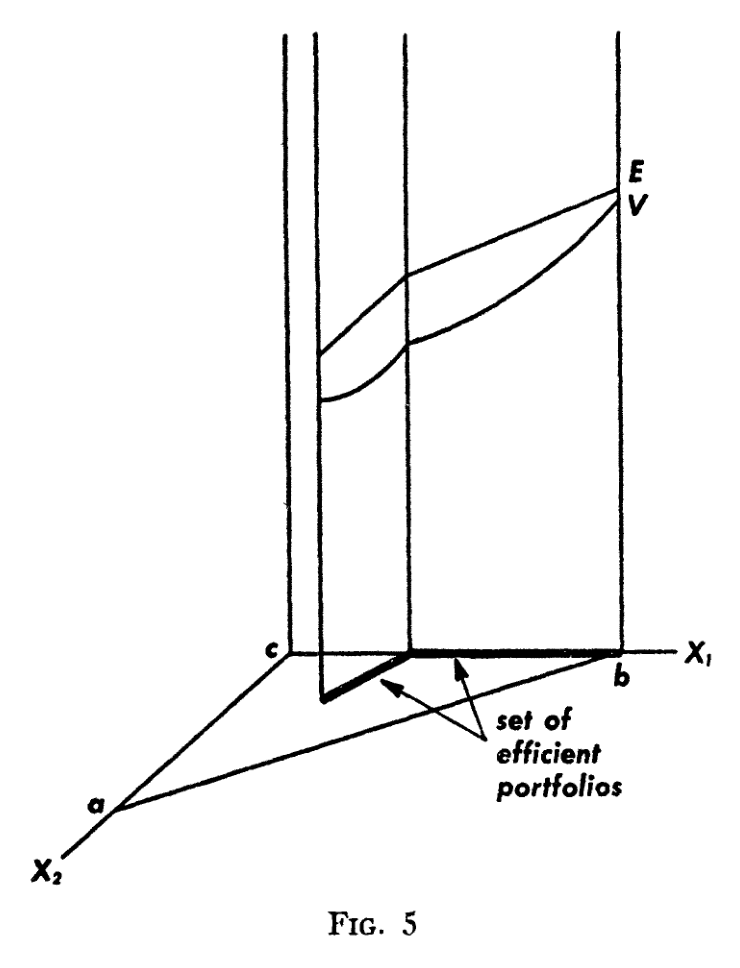
Map how dollars, customers, and intangible capital move through the business to find the few areas that are most limiting your profits.
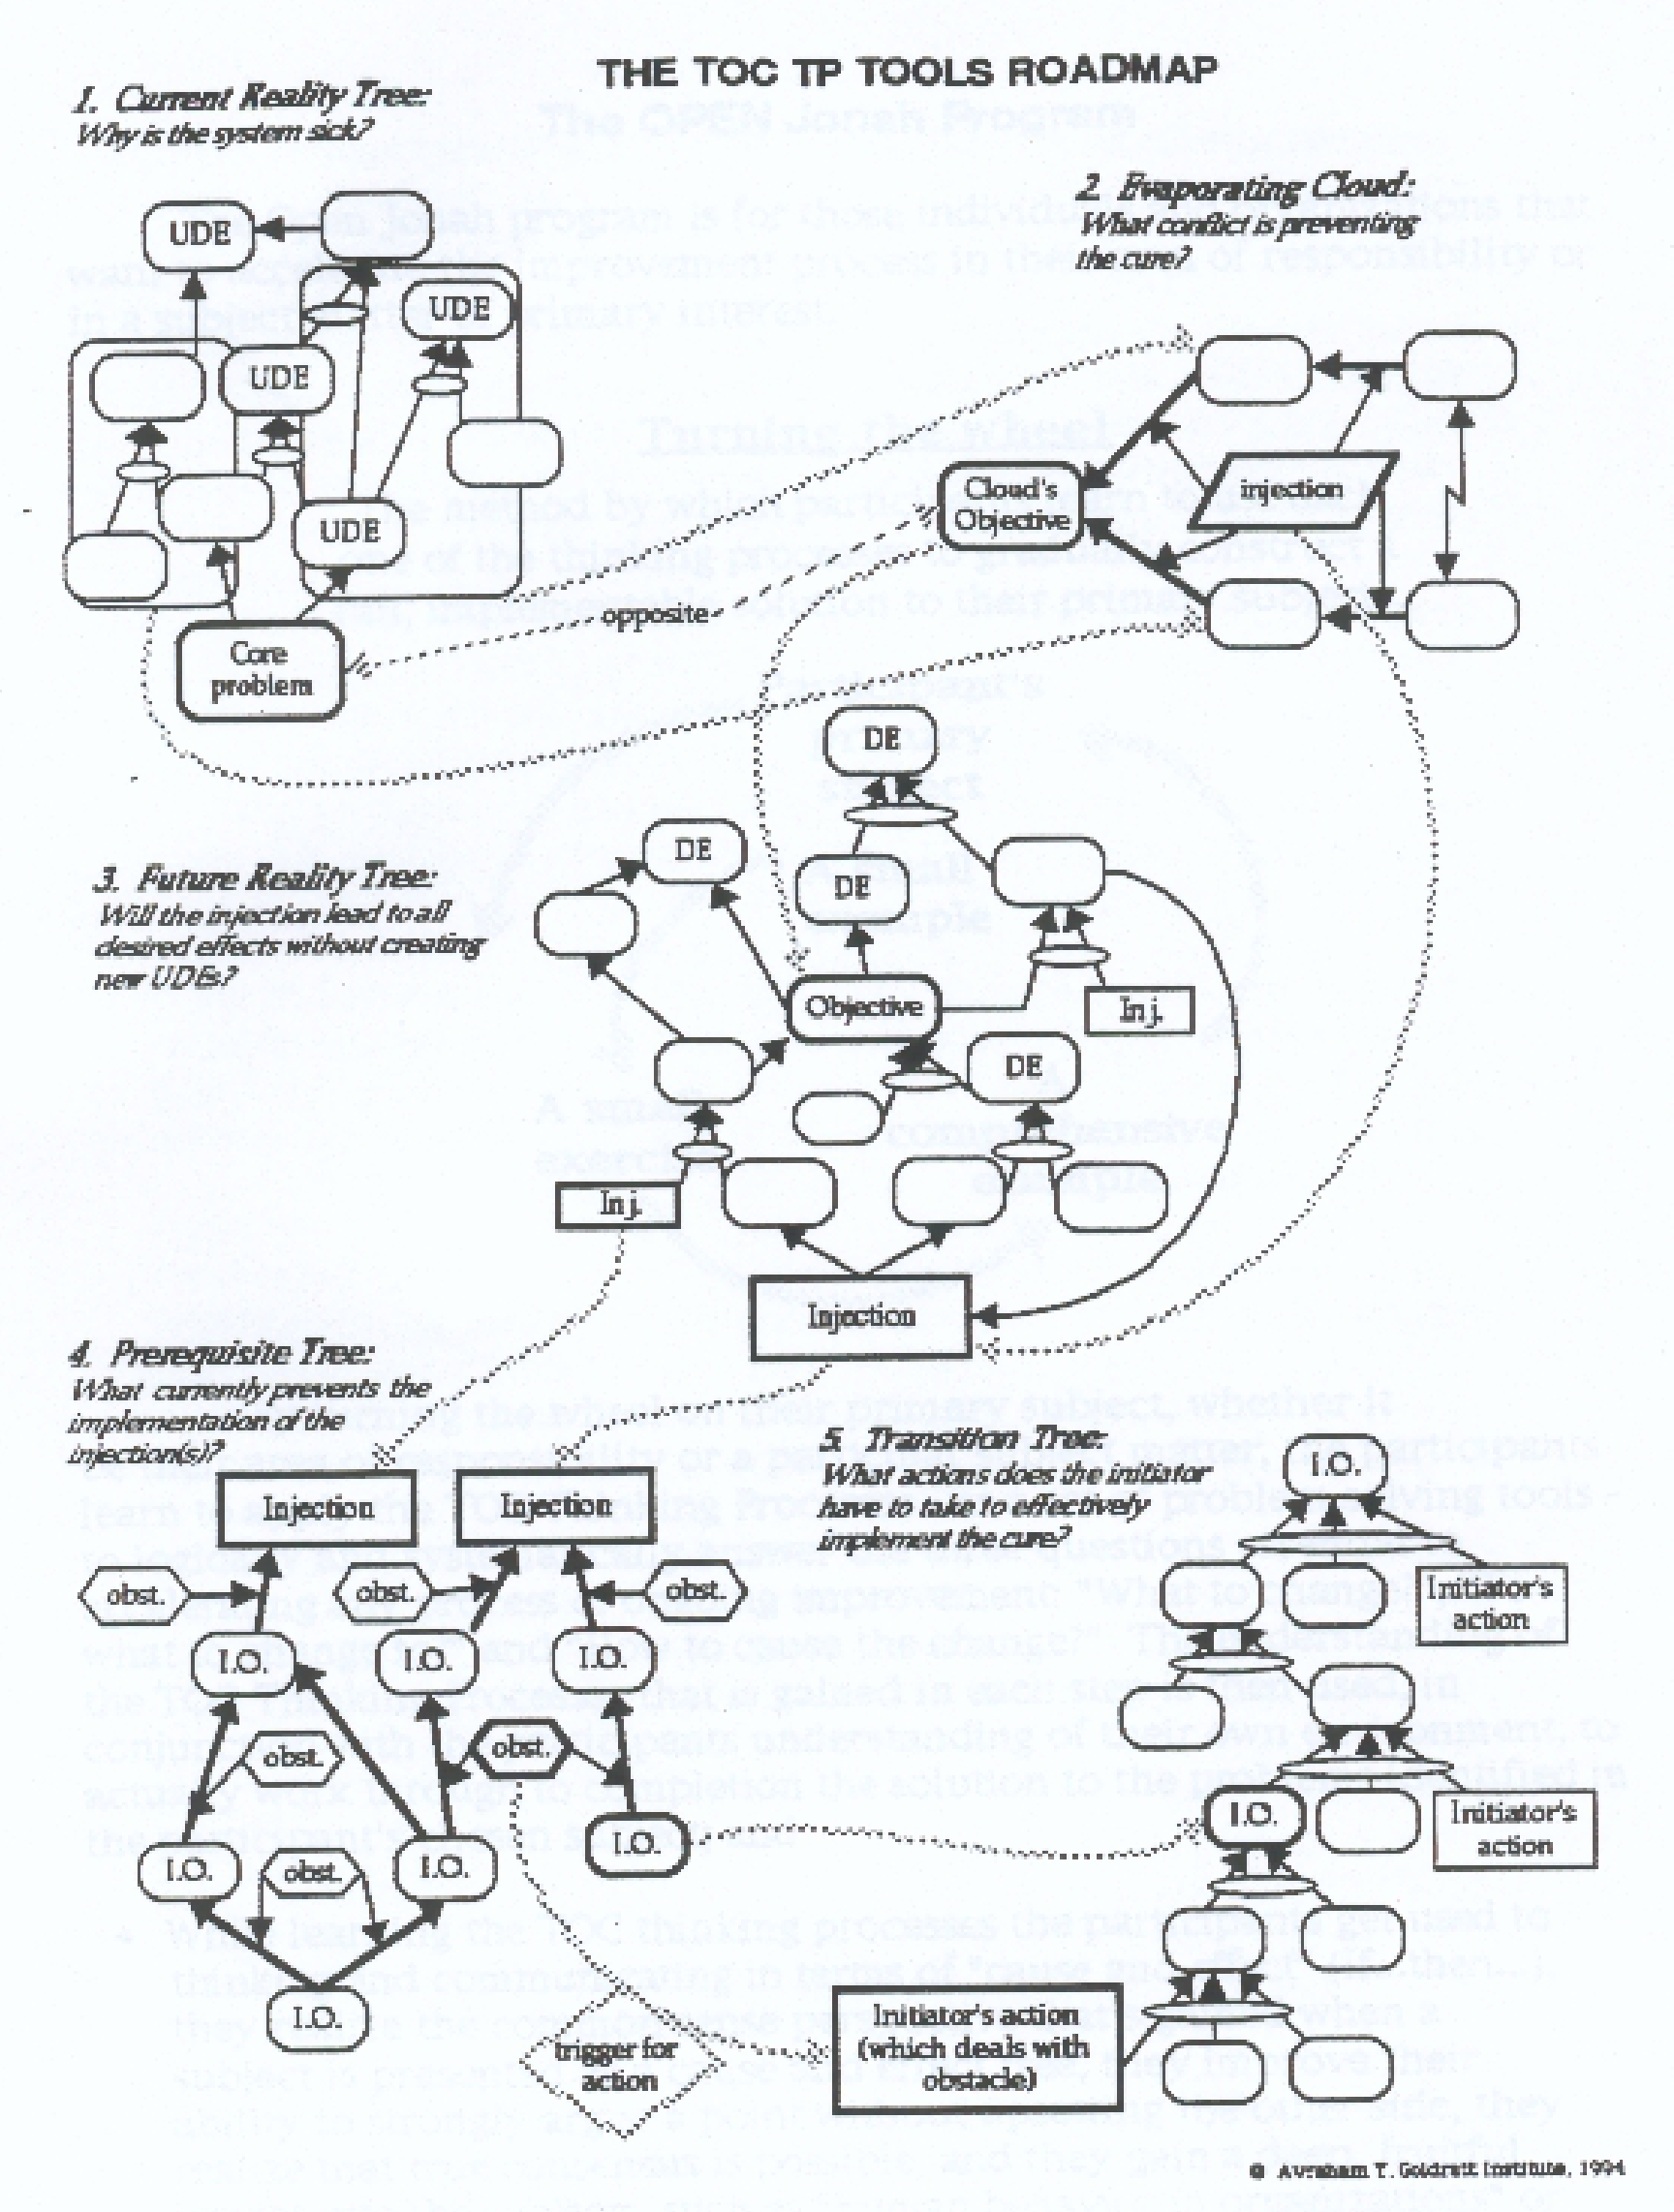
For the constraints found above, design interventions that better allocate scarce resources or increase capacity. Each intervention is decomposed by risk, reward, and the evidence substantiating our forecast.
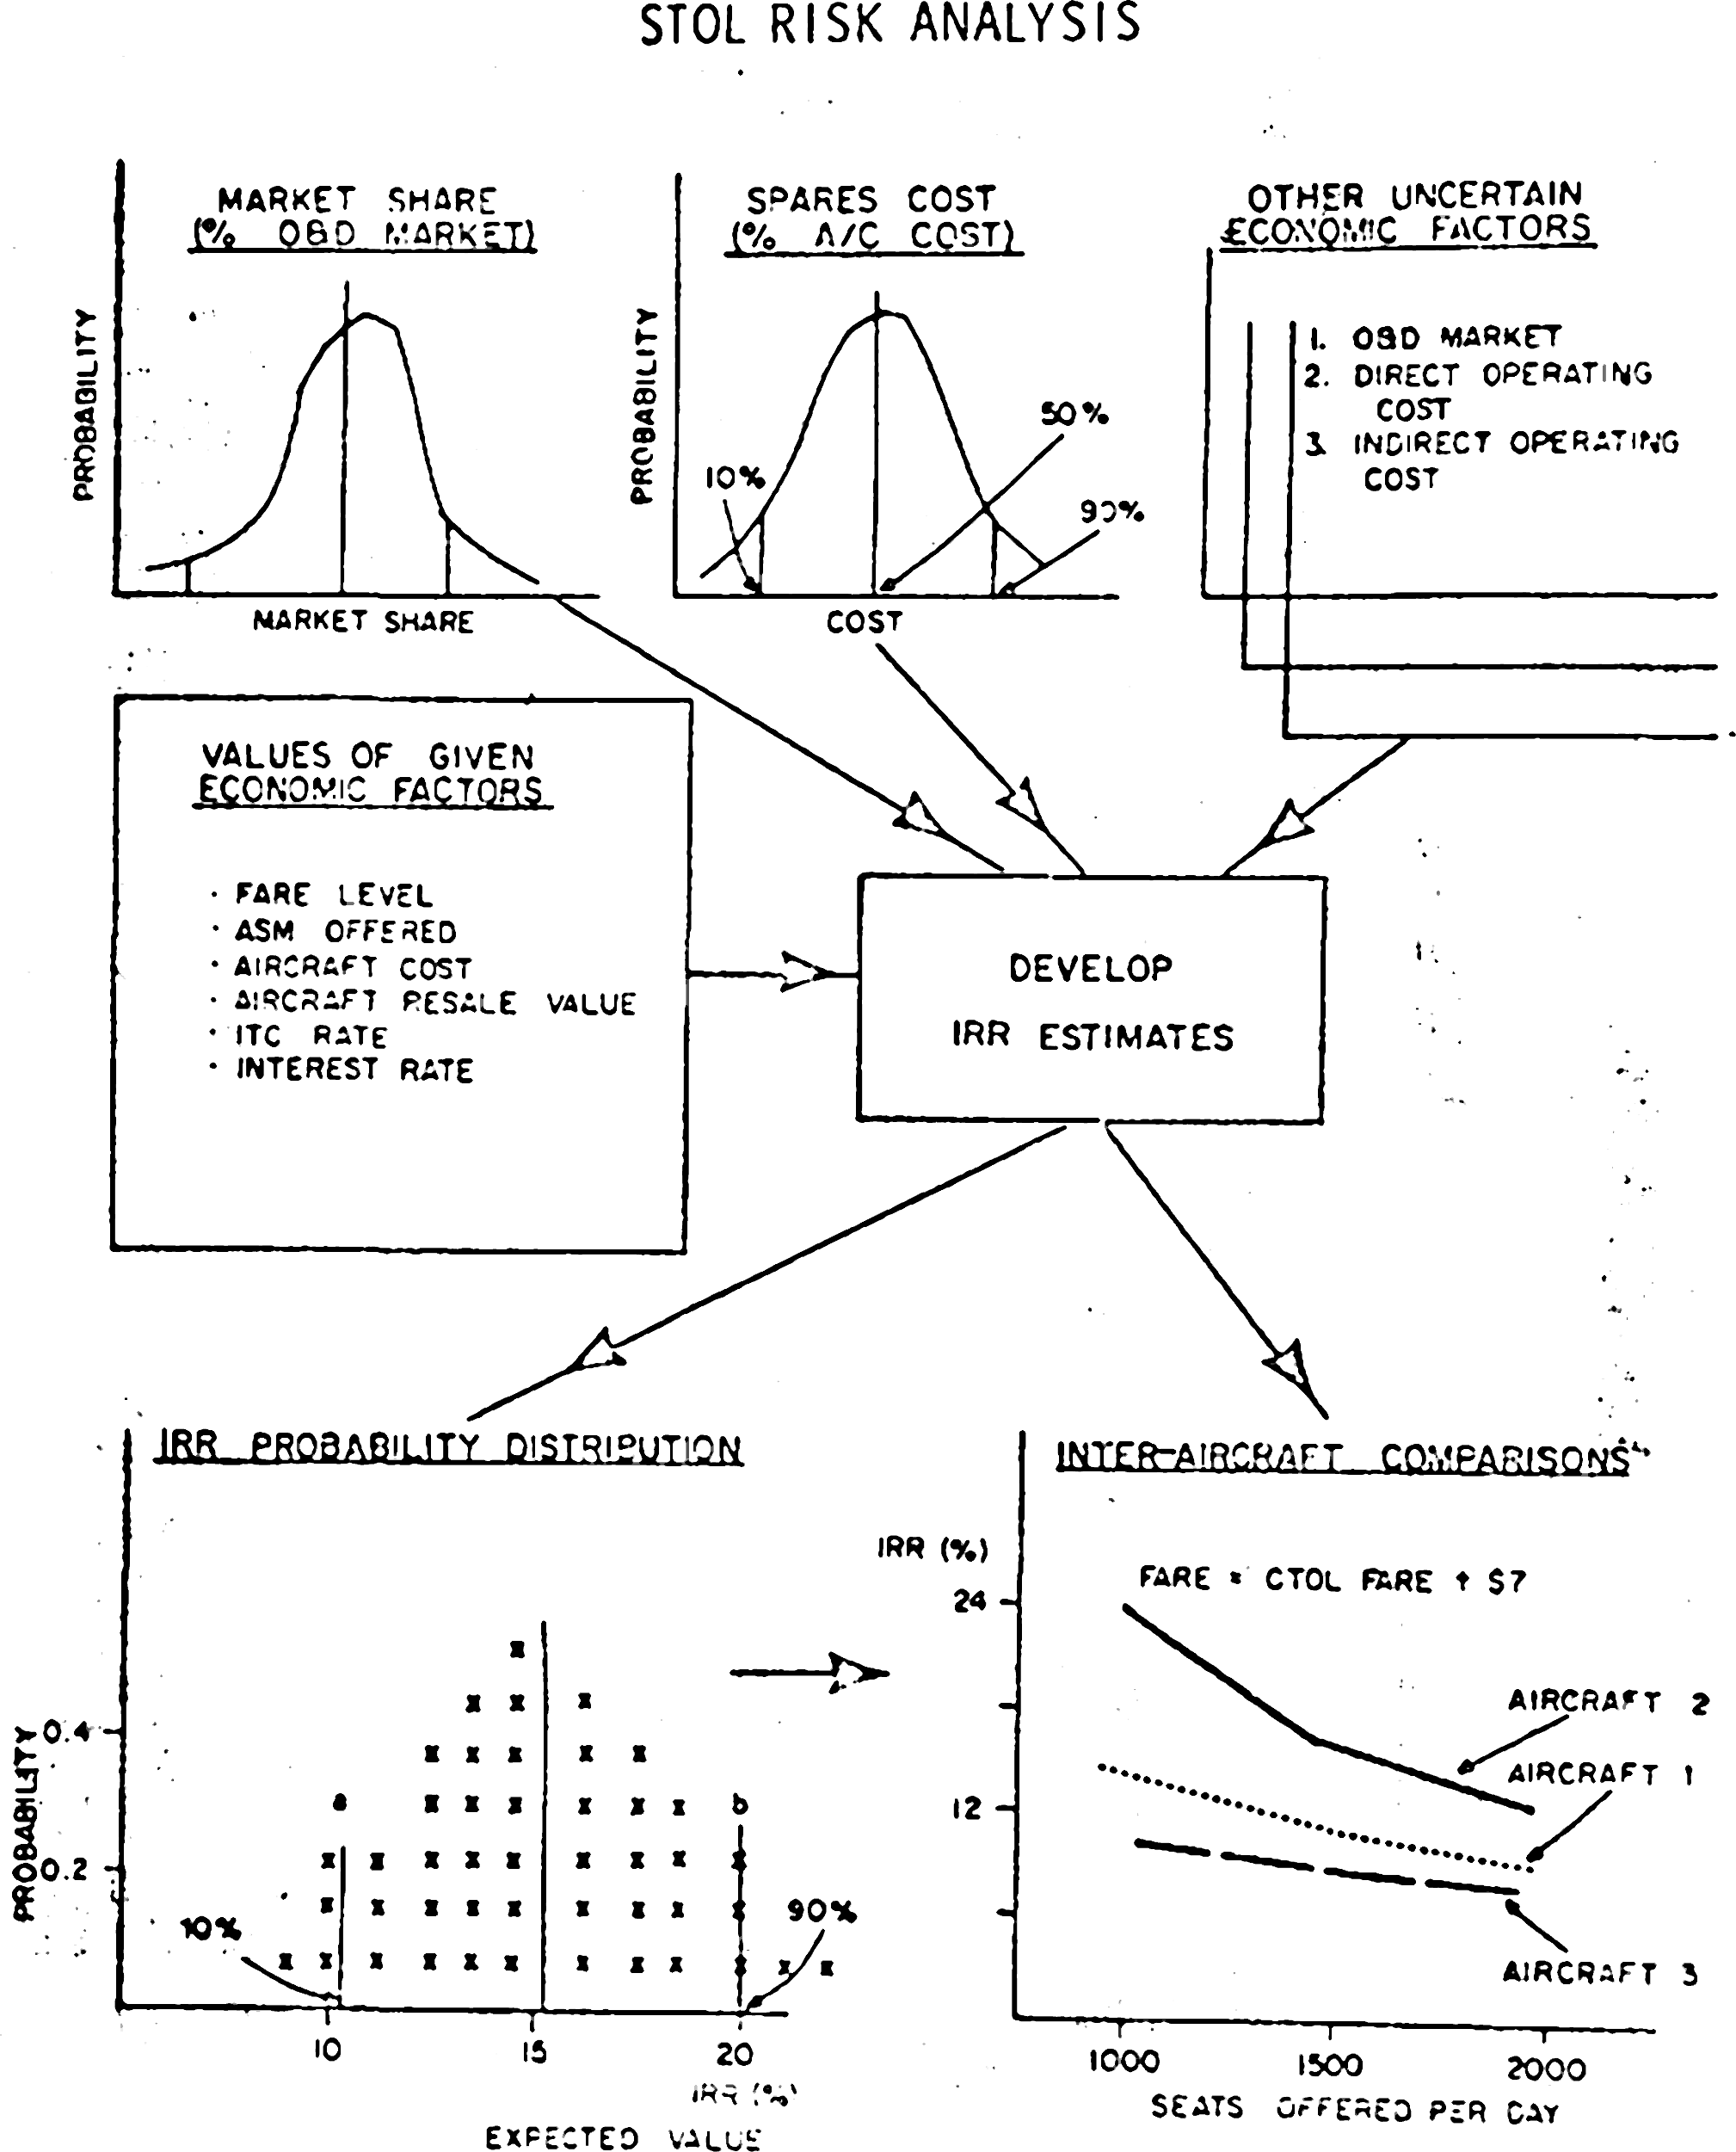
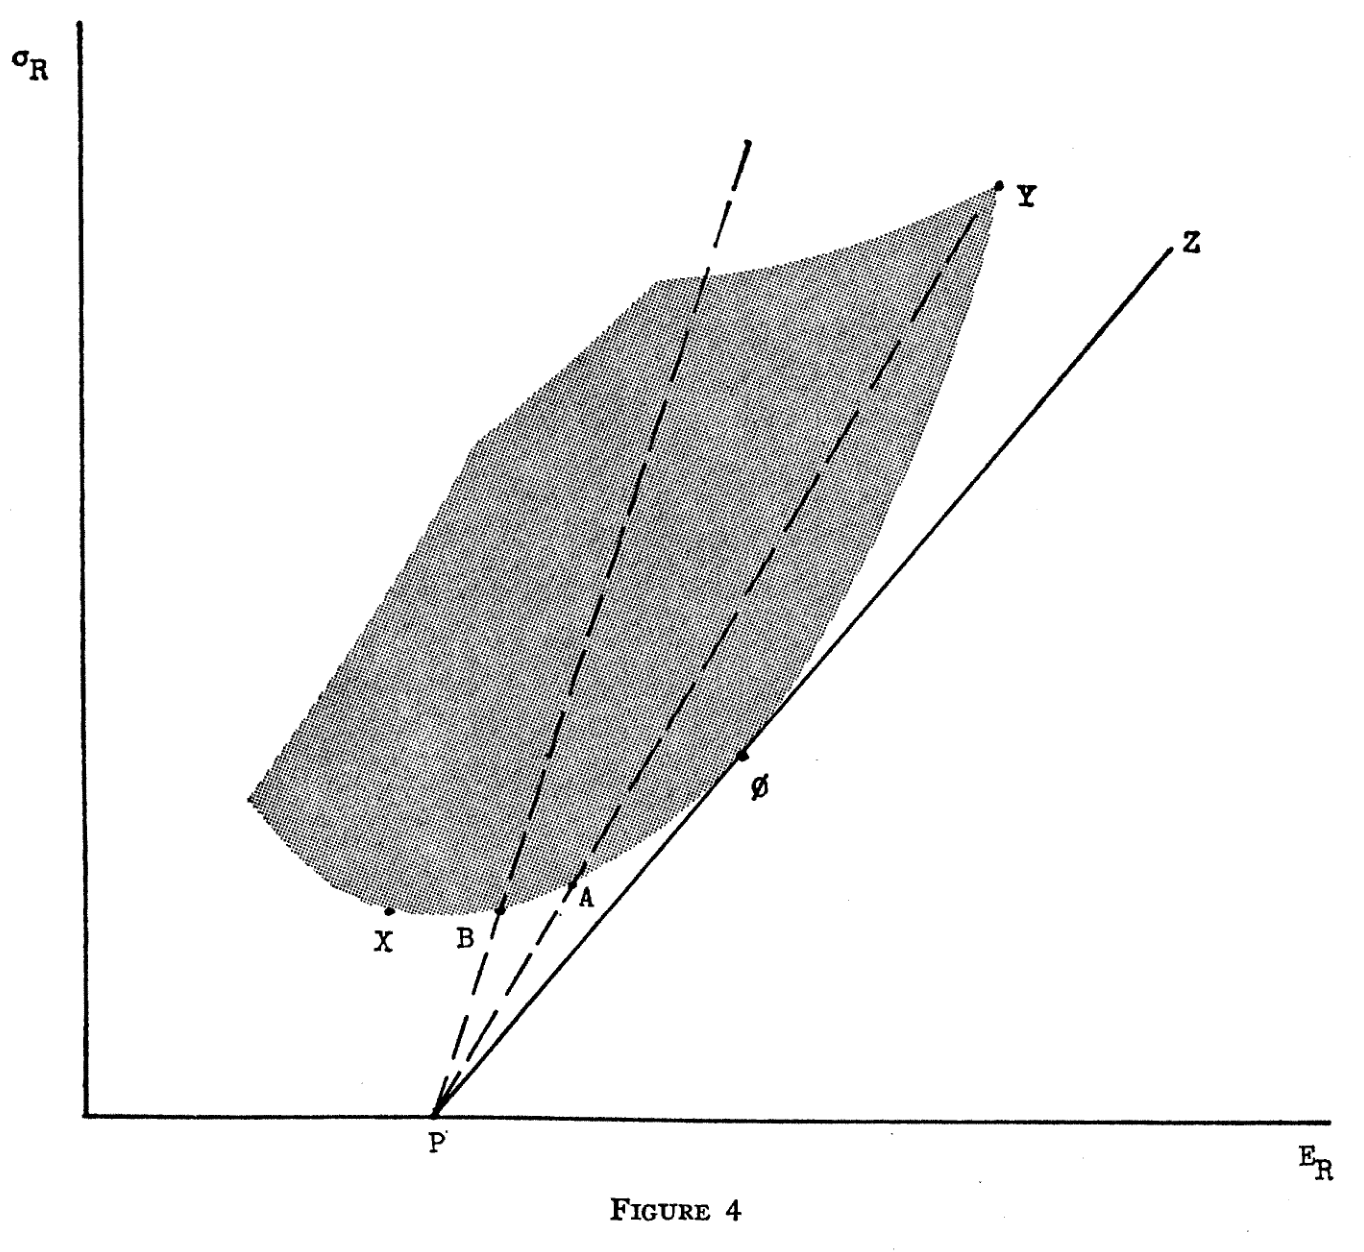
Rank the interventions above as a portfolio that is optimal for your cash flow requirements, risk appetite, and exposure to correlated failures.
Areas of focus
Know the best levers to pull and avoid bad assets.
Gross revenue retention and customer lifetime value.
P&L observability and evidencing.
Call-center back-office handle times.
Instrumentation leading to actionable metrics.
W-02 / Team

Rai Sur
Founder & CEO
Formerly CTO of Andreessen Horowitz–backed fintech, Alongside Finance ↗

Andrew Templeton
Review Partner for all deliverables · Advisory Board
Group CTO, CSC / Generation ↗